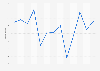
| Characteristic | Ipsos economic Index |
|---|---|
| - | - |
| - | - |
| - | - |
| - | - |
| - | - |
| - | - |
| - | - |
| - | - |
| - | - |
| - | - |
| - | - |
| - | - |
| - | - |
| - | - |
| - | - |
| - | - |
| - | - |
| - | - |
| - | - |
| - | - |
| - | - |
| - | - |
| - | - |
| - | - |
| - | - |
The chart is not accessible to screen readers. Please switch to the table view to access the data.
Download
Source
Source
Release date
October 2022
More information
Region
Asia, China
Survey time period
October 2020 to October 2022
Number of respondents
1,000+ adults
Age group
16 to 74 years
Special properties
survey sample were more urban and educated, and with higher incomes than the national average
Method of interview
Online panel
Supplementary notes
The Index is normalized to a 0 to 100-point range with 鈥�50鈥� representing the historical median. Index values are calculated by utilizing data from individual survey question results.
The index reflects respondent perceptions of current economic climate, ability to make household purchases, job security, and investment confidence in their country.
The source does not provide a release date. The date given is the date of data access.
Citation formats