| Characteristic | Percentage change in mobility compared to baseline |
|---|---|
| - | - |
| - | - |
| - | - |
| - | - |
| - | - |
| - | - |
The chart is not accessible to screen readers. Please switch to the table view to access the data.
Download
Source
Source
Release date
May 2020
More information
Region
Germany
Survey time period
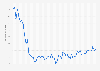
March 29, 2020 to May 2, 2020
Supplementary notes
* Mobility trends for places like restaurants, cafes, shopping centers, theme parks, museums, libraries, and movie theatres. Change compared to baseline, which the source explains as "the media value, for the corresponding day of the week, during the 5-week period Jan 3 - Feb 6, 2020."
Figures for preceding weeks are taken from the previous reports also published by the source.
Citation formats