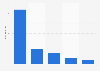
| Characteristic | Traffic | Average session duration | Page visit per session | Conversion rate | Total conversion |
|---|---|---|---|---|---|
| - | - | - | - | - | - |
| - | - | - | - | - | - |
| - | - | - | - | - | - |
| - | - | - | - | - | - |
| - | - | - | - | - | - |
The chart is not accessible to screen readers. Please switch to the table view to access the data.
Download
Source
Source
Release date
April 2020
More information
Region
France
Survey time period
February 24 to March 29, 2020**
Supplementary notes
* The source adds the following information: 1,386,220,227 (9 - 15 March, 2020), 1,500,125,631 (16 - 22 March, 2020) and 1,014,161,044 sessions (23 - 29 March) carried out by French users geolocated in France were ananlysed.
** According to the source, the study was carried out in February 24 to March 29, 2020, after the rise in Covid-19 outbreak in France and was compared to the values before the outbreak in January 6th until February 16th, 2020. The values before the outbreak were not provided by the source.
Citation formats