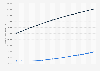
| Characteristic | Low estimate | High estimate |
|---|---|---|
| All physicians | 46,900 | 121,900 |
| Primary care physicians | 21,100 | 55,200 |
| Specialists | 24,800 | 65,800 |
| Surgical specialists | 14,300 | 23,400 |
The chart is not accessible to screen readers. Please switch to the table view to access the data.
Loading statistic...
Download
Source
Source
Release date
April 2019
More information
Region
United States
Survey time period
2017
Supplementary notes
* As of 2017
Note: The range of the projected shortfall for total physicians is smaller than the sum of the ranges of the projected shortfalls for the specialty categories. The demand scenarios modeled project future demand for physician services, but scenarios can differ in terms of whether future demand will be provided by primary care or nonprimary care physicians. Likewise, the shortfall range for total nonprimary care is smaller than the sum of the shortfall ranges for the specialty categories.
Citation formats