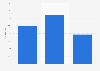
| Characteristic | Prepared | Unprepared | Don't know |
|---|---|---|---|
| Finance and Accounting | 70% | 26% | 4% |
| Medical & health services | 70% | 26% | 4% |
| Legal | 69% | 31% | 0% |
| Construction | 67% | 26% | 7% |
| Education | 62% | 29% | 9% |
| Transportation & distribution | 56% | 43% | 0% |
| All SMEs | 55% | 38% | 6% |
| Other | 55% | 35% | 10% |
| Media/marketing/advertising/PR & sales | 51% | 38% | 11% |
| Hospitality and leisure | 51% | 45% | 4% |
| Retail | 49% | 47% | 4% |
| IT & telecoms | 48% | 45% | 6% |
| Manufacturing | 48% | 45% | 7% |
| Real estate | 31% | 69% | 0% |
The chart is not accessible to screen readers. Please switch to the table view to access the data.
Loading statistic...
Download
Source
Source
Release date
January 2020
More information
Region
United Kingdom
Survey time period
January 20-22, 2020
Number of respondents
1,025 respondents
Special properties
SME business decision makers
Supplementary notes
Prepared is the net share of businesses that are either very or fairly prepared, with the share of unprepared being the share that are very of fairly unprepared.
Citation formats