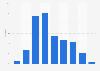
| Characteristic | Employment rate |
|---|---|
| - | - |
| - | - |
| - | - |
| - | - |
| - | - |
| - | - |
| - | - |
| - | - |
| - | - |
The chart is not accessible to screen readers. Please switch to the table view to access the data.
Download
Source
Sources
Release date
January 2023
More information
Region
Myanmar [Burma]
Survey time period
2010 to 2019
Supplementary notes
Note: figures for 2014 included those who were 15 to 64 years old from the Myanmar population and Housing Census. For 2015, data is included for those who are 15 years and above from the Myanmar Labor force Child Labor and School-to-Work Transition Survey. For 2017, data is included for those who are 15 years and above.
Source did not provide figures for 2016. Data for 2011, 2012, and 2013 comes from previous reporting.
Citation formats