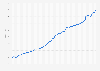
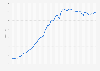
| Characteristic | Labor productivity in 2017 U.S. dollars |
|---|---|
| - | - |
| - | - |
| - | - |
| - | - |
| - | - |
| - | - |
| - | - |
| - | - |
| - | - |
| - | - |
| - | - |
| - | - |
| - | - |
| - | - |
| - | - |
| - | - |
| - | - |
| - | - |
| - | - |
The chart is not accessible to screen readers. Please switch to the table view to access the data.
Download
Source
Source
Release date
March 2018
More information
Region
Myanmar [Burma]
Survey time period
2000 to 2018
Supplementary notes
* According to the source, 2017 U.S. dollars = converted to 2017 price level with updated 2011 PPPs (Purchasing power parity)
Citation formats