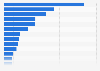
| Characteristic | Total number of employees in thousands |
|---|---|
| United Kingdom | 61.4 |
| Czechia | 59.6 |
| Slovakia | 57.9 |
| Hungary | 55.4 |
| Slovenia | 51.8 |
| Germany | 50.8 |
| Croatia | 47 |
| Netherlands | 45.3 |
| Finland | 43.6 |
| Ireland | 43.3 |
| Austria | 43.1 |
| EU28 | 42.1 |
| Estonia | 41.8 |
| Belgium | 40.5 |
| Latvia | 40 |
| Malta | 39.1 |
| Sweden | 38.8 |
| Poland | 38.3 |
| Italy | 37.9 |
| Bulgaria | 37.1 |
| France | 36.9 |
| Denmark | 35.6 |
| Romania | 28.1 |
| Spain | 26.8 |
| Lithuania | 24.4 |
| Cyprus | 17.1 |
| Greece | 16.7 |
| Portugal | 16.5 |
The chart is not accessible to screen readers. Please switch to the table view to access the data.
Loading statistic...
Download
Source
Source
Release date
October 2019
More information
Region
Europe, EU
Survey time period
2018
Supplementary notes
Employment as defined by the International Labour Organization comprises "all persons of working age who during a specified brief period, such as one week or one day, were in the following categories: a) paid employment (whether at work or with a job but not at work); or b) self-employment (whether at work or with an enterprise but not at work)."
Data coverage corresponds to code H53 of the NACE_R2 of economic activities, which is postal and courier activities.
Citation formats