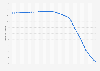
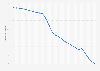
| Characteristic | Deaths per 1,000 live births |
|---|---|
| 2020 | 7 |
| 2015 | 10 |
| 2010 | 13 |
| 2005 | 20 |
| 2000 | 25 |
| 1995 | 26 |
| 1990 | 28 |
| 1985 | 31 |
| 1980 | 34 |
| 1975 | 32 |
| 1970 | 37 |
| 1965 | 48 |
| 1960 | 78 |
| 1955 | 142 |
| 1950 | 95.66 |
| 1945 | 115.57 |
| 1940 | 139.63 |
| 1935 | 168.7 |
| 1930 | 203.71 |
| 1925 | 245.78 |
| 1920 | 296.54 |
| 1915 | 357.77 |
| 1910 | 401.6 |
| 1905 | 417.11 |
| 1900 | 423.92 |
| 1895 | 446.61 |
| 1890 | 429.11 |
| 1885 | 442.08 |
| 1880 | 446.94 |
| 1875 | 441.4 |
| 1870 | 425.4 |
| 1865 | 404.22 |
| 1860 | 415.8 |
| 1855 | 418.74 |
The chart is not accessible to screen readers. Please switch to the table view to access the data.
Loading statistic...
Download
Source
Sources
Release date
June 2019
More information
Region
Russia
Survey time period
1855-2020
Supplementary notes
*As it is difficult to make estimates for such a large country with a tumultuous history, the figures given here appear to be averages for long periods of time then spread out over decades, therefore this information may not always be accurate, however it is the most reliable data available.
**All data given is an average of the preceding five year period.
Data prior to 1950 can be found .
Citation formats