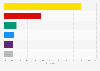
| Characteristic | Share of total votes |
|---|---|
| Socialdemokratiet | 25.9% |
| Venstre, Danmarks Liberale Parti | 23.4% |
| Dansk Folkeparti | 8.7% |
| Radikale Venstre | 8.6% |
| SF - Socialistisk Folkeparti | 7.7% |
| Enhedslisten - De R酶d-Gr酶nne | 6.9% |
| Det Konservative Folkeparti | 6.6% |
| Alternativet | 3% |
| Nye Borgerlige | 2.4% |
| Liberal Alliance | 2.3% |
| Stram Kurs | 1.8% |
| Kristendemokraterne | 1.7% |
| Klaus Risk忙r Pedersen | 0.8% |
The chart is not accessible to screen readers. Please switch to the table view to access the data.
Loading statistic...
Download
Source
Source
Release date
June 2019
More information
Region
Denmark
Survey time period
June 5, 2019
Age group
18 years and older
Supplementary notes
Danish Parliament (Folketing) elections are held every four years. Seats in the Danish Parliament (total number 179) are distributed in accordance with a method known as proportional representation. The system guarantees that political parties gain seats in the Danish Parliament in proportion to the number of votes cast for them throughout the country. For example, if a party wins 10 percent of the votes, it must also have 10 percent of the seats in the Parliament.
Citation formats