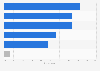
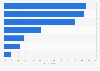
| Characteristic | Share of respondents |
|---|---|
| - | - |
| - | - |
| - | - |
The chart is not accessible to screen readers. Please switch to the table view to access the data.
797 respondents
18-64 years
e-commerce users who gave income information*
*Persons who had bought something online in the past 12 months in one of the following categories: bags & accessories, books, movies, music & games (excluding downloads), clothing, consumer electronics (e.g. TV, smartphones), cosmetics & body care, DIY, garden & pet products, drugstore & health products, food & drinks, furniture & household goods, household appliances, shoes, sports & outdoor products, stationery & hobby supplies, toys & baby products, other.
**Respondents are grouped in three income groups. The 鈥渓ow鈥� group contains all incomes up to the 33.3% quantile, the 鈥渕edium鈥� bracket contains all incomes between the 33.3% and the 66.6% quantile. The 鈥渉igh鈥� group contains all incomes above the 66.6% quantile.