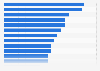
| Characteristic | Share of respondents |
|---|---|
| - | - |
| - | - |
| - | - |
| - | - |
| - | - |
| - | - |
| - | - |
| - | - |
| - | - |
| - | - |
| - | - |
| - | - |
| - | - |
| - | - |
| - | - |
| - | - |
| - | - |
| - | - |
| - | - |
| - | - |
| - | - |
The chart is not accessible to screen readers. Please switch to the table view to access the data.
Download
Source
Source
More information
Number of respondents
439 respondents
Age group
18 years and older
Special properties
Respondents who buy chips/crisps & similar snacks for their household on a regular basis. Residential online population.
Supplementary notes
During the survey, the question was phrased as follows: "Which of these brands of salty snacks have you bought during the past 3 months?"
Multiple answers were possible.
Citation formats