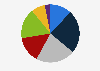
| Characteristic | Number of vehicles |
|---|---|
| - | - |
| - | - |
| - | - |
| - | - |
| - | - |
| - | - |
| - | - |
| - | - |
| - | - |
| - | - |
The chart is not accessible to screen readers. Please switch to the table view to access the data.
Download
Source
Source
Release date
January 2024
More information
Region
Singapore
Survey time period
2014 to 2023
Supplementary notes
The total vehicle population is as of December of each year.
Private cars here mean cars and station-wagons for personal and non-commercial use only.
Citation formats