| Characteristic | Funnel sessions in thousands |
|---|---|
| - | - |
| - | - |
| - | - |
| - | - |
| - | - |
| - | - |
| - | - |
The chart is not accessible to screen readers. Please switch to the table view to access the data.
Download
Source
Sources
Release date
October 2022
More information
Region
United Kingdom
Survey time period
2015 to 2021
Special properties
fiscal years ending December 31
Supplementary notes
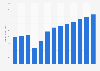
Funnel sessions are user interactions on the company's website that reach the travel funnels (flights, hotels, or car hire).
Figures prior to 2020 were previously published by the source.
This statistic is using original data from the Companies House and includes copyright material from 漏 Crown, licensed under the
Citation formats