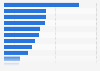
| Characteristic | Share of traffic |
|---|---|
| - | - |
| - | - |
| - | - |
| - | - |
| - | - |
| - | - |
| - | - |
| - | - |
| - | - |
| - | - |
The chart is not accessible to screen readers. Please switch to the table view to access the data.
Download
Source
Source
In cooperation with
SimilarWeb
Release date
October 2018
More information
Region
United Kingdom
Survey time period
July 1, 2018 to September 30, 2018
Supplementary notes
* The source for this data measured incoming traffic from the UK to the top ten websites for the travel category (online travel agencies (OTAs) and metasearch) on desktop and mobile for 3rd quarter 2018 (April 1, 2018 to June 30, 2018).
Citation formats