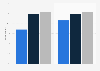
| Characteristic | Share of respondents |
|---|---|
| - | - |
| - | - |
| - | - |
The chart is not accessible to screen readers. Please switch to the table view to access the data.
Download
Source
Source
Release date
June 2017
More information
Region
United Kingdom
Survey time period
2007, 2012 and 2017
Number of respondents
2010*
Special properties
UK adults who will holiday in the UK
Supplementary notes
* 2017 respondent count. Number of survey respondents not provided for 2007 and 2012. The source also adds that the data was further supplemented by a UK representative survey of 2008 UK adults to provide a perspective on the wider hospitality industry - fieldwork conducted June 9-12, 2017.
Citation formats