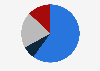
| Characteristic | Share of respondents |
|---|---|
| - | - |
| - | - |
| - | - |
| - | - |
| - | - |
| - | - |
| - | - |
| - | - |
| - | - |
| - | - |
The chart is not accessible to screen readers. Please switch to the table view to access the data.
Download
Source
Source
Release date
July 2018
More information
Region
Japan
Survey time period
March 14 to April 22, 2018
Number of respondents
21,000 consumers
Special properties
The survey covered 560 major corporate brands in Japan
Method of interview
Online survey
Supplementary notes
*Companies that ranked highest on SG perception.
Citation formats