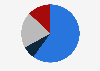
| Characteristic | Score points |
|---|---|
| - | - |
| - | - |
| - | - |
| - | - |
| - | - |
| - | - |
| - | - |
| - | - |
| - | - |
| - | - |
| - | - |
| - | - |
| - | - |
| - | - |
| - | - |
| - | - |
| - | - |
| - | - |
| - | - |
| - | - |
| - | - |
The chart is not accessible to screen readers. Please switch to the table view to access the data.
Download
Source
Source
Release date
July 2019
More information
Region
Japan
Survey time period
March 14 to April 21, 2019
Number of respondents
21,000 consumers
Special properties
The survey covered 560 major corporate brands in Japan
Supplementary notes
*Deviation value.
Respondents were asked if they want to work for each company or want to recommend their family members to work for each company. The ranking depicts the top ranking companies.
Citation formats