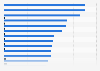
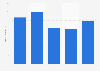
| City, state | Increase in cooling degree days |
|---|---|
| - | - |
| - | - |
| - | - |
| - | - |
| - | - |
| - | - |
| - | - |
| - | - |
| - | - |
| - | - |
The chart is not accessible to screen readers. Please switch to the table view to access the data.
Download
Source
Source
Release date
July 2018
More information
Region
United States
Survey time period
1970 to 2017
Number of respondents
244 cities
Supplementary notes
* Cooling degree days estimate the amount of artificial cooling needed to maintain a comfortable indoor temperature. They represent the number of degrees the daily average temperature is above or below 65 degrees Fahrenheit.
Citation formats