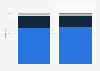
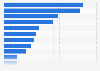
| Characteristic | Cash | Non-Cash |
|---|---|---|
| - | - | - |
| - | - | - |
| - | - | - |
| - | - | - |
| - | - | - |
| - | - | - |
| - | - | - |
| - | - | - |
| - | - | - |
| - | - | - |
The chart is not accessible to screen readers. Please switch to the table view to access the data.
Download
Source
Source
Release date
April 2017
More information
Region
Australia, Europe, United States
Survey time period
February 7 and February 27, 2017
Number of respondents
12,585 respondents
Age group
18 years and older
Special properties
15 Countries
Method of interview
Online survey
Supplementary notes
* Shares in Europe indicating whether they tend to pay with or without cash for specific items. People could also reply 鈥淚 never have this type of expense鈥�.
Survey includes 13 European countries as well as America and Australia.
Citation formats