| Characteristic | 2013 | 2014 | 2015 | 2016 | 2021 |
|---|---|---|---|---|---|
| - | - | - | - | - | - |
| - | - | - | - | - | - |
| - | - | - | - | - | - |
| - | - | - | - | - | - |
| - | - | - | - | - | - |
| - | - | - | - | - | - |
| - | - | - | - | - | - |
The chart is not accessible to screen readers. Please switch to the table view to access the data.
February 2021
France
2013 to 2021
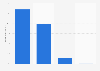
is composed of two distinct values: the bottom index, calculated from the measurements of the urban stations, and the traffic index, calculated from the measurements of the car proximity stations.
The background index takes into account the following pollutants: nitrogen dioxide (NO2), suspended dust (PM10) and ozone (O3). Sulfur dioxide (SO2), carbon monoxide (CO) and suspended dust (PM2.5) are considered as complementary pollutants.
The traffic index takes into account the following pollutants: nitrogen dioxide (NO2) and suspended dust (PM10). Carbon monoxide (CO) and suspended dust (PM2.5) are considered as complementary pollutants.
The scale of the Cit茅air index varies from 0 to more than 100. The higher the index, the poorer the air quality.
Very low pollution: 0 - 25
Low pollution: 25 - 50
Average pollution: 50 - 75
High pollution: 75 - 100
Very high pollution:> 100
Following an update, the source no longer indicates the exact value of indices greater than 100. The values 鈥嬧�媠hown here - which appeared on the Airparif website at the time of the creation of this statistic - therefore differ from those currently presented on the website. site.