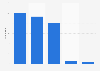
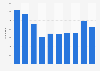
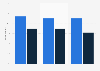
| Characteristic | Number of explosion incidents |
|---|---|
| - | - |
| - | - |
| - | - |
| - | - |
| - | - |
| - | - |
| - | - |
| - | - |
The chart is not accessible to screen readers. Please switch to the table view to access the data.
Download
Source
Source
Release date
September 2025
More information
Region
United States
Survey time period
2023
Supplementary notes
According to the source data "does not represent the actual quantity of identified containers. For example, if a pipe bomb was identified, the numbers below do not show if there were 5 pipe bombs taped together with 10 end caps, but rather they show at least 1 pipe and 1 end cap associated with that incident. However, if there were two identical container types recovered in the same incident but both consisted of independent material subtypes, then both would be counted."
Citation formats