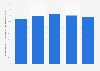

| Characteristic | Time spent in hours |
|---|---|
| - | - |
| - | - |
| - | - |
| - | - |
| - | - |
| - | - |
| - | - |
| - | - |
The chart is not accessible to screen readers. Please switch to the table view to access the data.
Download
Source
Source
Release date
October 2020
More information
Region
United States
Survey time period
August 1 to 12, 2020
Number of respondents
500 respondents
Age group
18 years and older
Method of interview
Online panel
Supplementary notes
Data is based on 5,000 responses from consumers in France, Germany, India, Indonesia, Italy, Japan, Singapore, South Korea, the United Kingdom, and the United States, ages 18 and older, who watch one hour or more of online video content each week.
Original question: How much of your online video viewing time is spent in hours watching the following types of content each week?
Citation formats