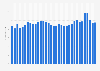
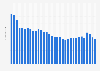
| Characteristic | Average number of viewers in thousands |
|---|---|
| - | - |
| - | - |
| - | - |
| - | - |
| - | - |
| - | - |
| - | - |
| - | - |
| - | - |
| - | - |
| - | - |
| - | - |
| - | - |
| - | - |
| - | - |
| - | - |
| - | - |
| - | - |
| - | - |
| - | - |
| - | - |
| - | - |
| - | - |
| - | - |
| - | - |
| - | - |
| - | - |
| - | - |
| - | - |
| - | - |
| - | - |
| - | - |
| - | - |
The chart is not accessible to screen readers. Please switch to the table view to access the data.
Download
Source
Source
Release date
January 2020
More information
Region
Italy
Survey time period
1987 to 2019
Supplementary notes
Data refer to the average TV audience on both free-to-air and pay-TV channels as follows:
1987 to 1996: RAI, Mediaset;
1997 to 2003: RAI, (pay-TV) Tele+;
2004 to 2006: RAI;
2007 to 2009: RAI, (pay-TV) Sky;
2010 to 2012: RAI;
2013 to 2017: (pay-TV) Sky, RAI (catch-up TV);
2018 and 2019: (pay-TV) Sky, TV8 (catch-up TV).
Citation formats