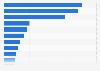
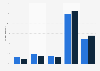
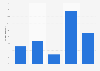
| Characteristic | Asian | Black or African American | Hispanic American or Latino | White/ Caucasian | Would rather not say | Other |
|---|---|---|---|---|---|---|
| I use it regularly | 7% | 13% | 7% | 5% | 8% | 7% |
| I use it occasionally | 12% | 15% | 19% | 8% | 8% | 15% |
| I have used it once | 5% | 5% | 11% | 8% | 8% | 7% |
| I can imagine using it | 49% | 58% | 46% | 51% | 54% | 52% |
| I won't use it | 26% | 10% | 18% | 28% | 23% | 19% |
The chart is not accessible to screen readers. Please switch to the table view to access the data.
Loading statistic...
Download
Source
Source
Release date
April 2017
More information
Region
United States
Survey time period
March 2-7, 2017
Number of respondents
962 respondents
Age group
18 years and older
Special properties
owners of a smartphone and/or tablet
Method of interview
Online survey
Supplementary notes
Original question: "The following is a selection of different e-health apps for smartphones and tablets. Could you imagine using any of them? [ answers for: apps to relieve stress/promote inner peace, for instance through meditation, light yoga exercises, or similar activities (e.g. smiling mind, Mindfulness, Breathe2Relax)]"
Citation formats