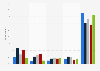
| Characteristic | Black or African American | Hispanic American or Latino | White/ Caucasian | Other | Would rather not say |
|---|---|---|---|---|---|
| Positively. I received support and was offered help | 60% | 45% | 39% | 53% | 43% |
| Neutrally. My burnout was taken note of | 27% | 32% | 24% | 27% | 14% |
| Negatively. My illness was ignored and/or I was reproached | 0% | 18% | 9% | 13% | 0% |
| I didn't tell these persons | 13% | 5% | 28% | 7% | 43% |
The chart is not accessible to screen readers. Please switch to the table view to access the data.
Loading statistic...
Download
Source
Source
Release date
February 2017
More information
Region
United States
Survey time period
February 9 to 13, 2017
Number of respondents
149 respondents
Age group
18 years and older
Special properties
Respondents who were diagnosed with burnout
Method of interview
Online survey
Supplementary notes
Original question: How did your family respond to your burnout diagnosis?
Respondents could choose one option.
Citation formats