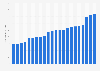
| Characteristic | Average player salary in million U.S. dollars |
|---|---|
| New York Yankees | 7.69 |
| Boston Red Sox | 6.96 |
| Chicago Cubs | 6.39 |
| Houston Astros | 6.36 |
| Philadelphia Phillies | 5.85 |
| Los Angeles Angels | 5.21 |
| St Louis Cardinals | 5.19 |
| Washington Nationals | 5.18 |
| New York Mets | 5.11 |
| Los Angeles Dodgers | 5.04 |
| San Francisco Giants | 4.88 |
| Atlanta Braves | 4.77 |
| Colorado Rockies | 4.7 |
| Milwaukee Brewers | 3.91 |
| Cleveland Guardians | 3.65 |
| Minnesota Twins | 3.64 |
| Texas Rangers | 3.44 |
| Seattle Mariners | 3.3 |
| Detroit Tigers | 3.12 |
| Cincinnati Reds | 3.07 |
| San Diego Padres | 2.97 |
| Chicago White Sox | 2.82 |
| Oakland Athletics | 2.77 |
| Arizona Diamondbacks | 2.53 |
| Baltimore Orioles | 2.32 |
| Kansas City Royals | 2.23 |
| Miami Marlins | 2.07 |
| Tampa Bay Rays | 1.98 |
| Toronto Blue Jays | 1.93 |
| Pittsburgh Pirates | 1.69 |
The chart is not accessible to screen readers. Please switch to the table view to access the data.
Loading statistic...
Download
Source
Source
Release date
December 2019
More information
Region
Canada, United States
Survey time period
2019
Citation formats