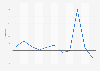
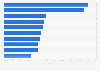
| Characteristic | Change to prior year |
|---|---|
| - | - |
| - | - |
| - | - |
| - | - |
| - | - |
| - | - |
| - | - |
| - | - |
| - | - |
| - | - |
| - | - |
| - | - |
| - | - |
| - | - |
| - | - |
| - | - |
| - | - |
| - | - |
| - | - |
| - | - |
The chart is not accessible to screen readers. Please switch to the table view to access the data.
Download
Source
Source
Release date
June 2020
More information
Region
United States
Survey time period
2019
Special properties
Rankings are by estimated U.S. wholesale bedding shipments.
Supplementary notes
Figures exclude shipments to Puerto Rico and private-label business. Sales allowances, incentives and cash discounts are included, where that information is available.
* Includes shipments of its Sealy and Steams & Foster brands and shipments from its single licensee, Sealy Mattress Co. of New Jersey.
** Includes both Eclipse and Eastman House brands. Does not include private-label Saatva business.
Citation formats