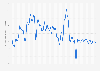
| Characteristic | Economic Sentiment Indicator |
|---|---|
| Mar '26 | 100.7 |
| Feb '26 | 102 |
| Jan '26 | 102.6 |
| Dec '25 | 101.2 |
| Nov '25 | 101.9 |
| Oct '25 | 100.8 |
| Sep '25 | 99.4 |
| Aug '25 | 98.6 |
| Jul '25 | 99.6 |
| Jun '25 | 99.1 |
| May '25 | 98.8 |
| Apr '25 | 95.9 |
| Mar '25 | 97.7 |
| Feb '25 | 99.7 |
| Jan '25 | 100 |
| Dec '24 | 98.2 |
| Nov '24 | 99.2 |
| Oct '24 | 99.4 |
| Sep '24 | 99.8 |
| Aug '24 | 98.8 |
| Jul '24 | 100.1 |
| Jun '24 | 99.8 |
| May '24 | 100.4 |
| Apr '24 | 99.6 |
| Mar '24 | 100.9 |
| Feb '24 | 99.4 |
| Jan '24 | 100.9 |
| Dec '23 | 99.2 |
| Nov '23 | 97.5 |
| Oct '23 | 96.9 |
| Sep '23 | 97.8 |
| Aug '23 | 100 |
| Jul '23 | 101.1 |
| Jun '23 | 101 |
| May '23 | 102.2 |
| Apr '23 | 104.5 |
| Mar '23 | 104.4 |
| Feb '23 | 102.6 |
| Jan '23 | 102.6 |
The chart is not accessible to screen readers. Please switch to the table view to access the data.
Loading statistic...
Download
Source
Source
Release date
April 2026
More information
Region
Italy
Survey time period
January 2023 to March 2026
Special properties
Seasonally adjusted
Supplementary notes
The Economic Sentiment Indicator (ESI) is a composite indicator made up of five sectoral confidence indicators with different weights: Industrial confidence indicator; Services confidence indicator; Consumer confidence indicator; Construction confidence indicator; Retail trade confidence indicator.
Citation formats