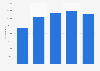
| Characteristic | Share of respondents |
|---|---|
| - | - |
| - | - |
| - | - |
| - | - |
| - | - |
| - | - |
| - | - |
The chart is not accessible to screen readers. Please switch to the table view to access the data.
Download
Source
Source
Release date
April 2015
More information
Region
India
Survey time period
December 2014
Number of respondents
1,000 consumers
Special properties
among digital consumers
Supplementary notes
Numbers are not likely to add up to 100 because of rounding off.
The time periods mentioned begin from the time of the survey, i.e December 2014.
Survey question: When do you expect to replace the car that you drive most often?
Citation formats