| Characteristic | Year-on-year change |
|---|---|
| - | - |
| - | - |
| - | - |
| - | - |
| - | - |
| - | - |
| - | - |
| - | - |
| - | - |
| - | - |
| - | - |
| - | - |
| - | - |
| - | - |
| - | - |
The chart is not accessible to screen readers. Please switch to the table view to access the data.
Download
Source
Source
Release date
January 2025
More information
Region
China
Survey time period
2010 to 2024
Supplementary notes
*Figures from 2010 to 2023 were taken from previous reports.
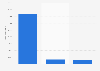
Data prior to 2012 were taken from the J.P. Morgan report "China Auto Industry" from August 2012, page 13. Figures from 2012 were taken from annual sales figures provided by China Association of Automobile Manufacturers (CAAM). The report also cites CAAM as a source.
The data only cover manufacturer sales to dealers, rather than end-user demand.
Citation formats