

| Characteristic | Will decrease | Will stay the same | Will increase |
|---|---|---|---|
| - | - | - | - |
| - | - | - | - |
| - | - | - | - |
| - | - | - | - |
| - | - | - | - |
| - | - | - | - |
| - | - | - | - |
| - | - | - | - |
| - | - | - | - |
| - | - | - | - |
| - | - | - | - |
| - | - | - | - |
| - | - | - | - |
| - | - | - | - |
| - | - | - | - |
| - | - | - | - |
The chart is not accessible to screen readers. Please switch to the table view to access the data.
Download
Source
Source
Release date
May 2016
More information
Region
Finland
Survey time period
2016, weeks 12 and 13
Number of respondents
n=1036
Age group
15-74 years
Method of interview
Online panel
Supplementary notes
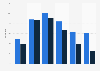
The question was phrased by the source as follows: "How do you see your personal usage of the following digital services to develop during the next 12 months?"
Citation formats



