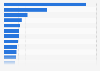
| Characteristic | Profit in million EUR |
|---|---|
| Takeda Pharma A/S | 11,352 |
| Weibel Scientific A/S | 7,005 |
| E-boks A/S | 6,781 |
| Novo Nordisk A/S | 6,500 |
| Investor AB | 5,293 |
| Exxonmobil Exploration And Production Norway AS | 4,275 |
| Kinnevik AB | 4,095 |
| AstraZeneca AB | 3,588 |
| DNB ASA | 3,162 |
| Ericsson Telefon AB LM | 2,711 |
| Volvo AB | 2,582 |
| Sampo Oyj | 2,482 |
| Telenor ASA | 2,126 |
| Statkraft AS | 1,922 |
| Atlas Copco AB | 1,875 |
| Melker Sch枚rling Tj盲nste AB | 1,859 |
| Melker Sch枚rling AB | 1,859 |
| Lundin Norway AS | 1,728 |
| Essity AB | 1,574 |
| Lego A/S | 1,439 |
The chart is not accessible to screen readers. Please switch to the table view to access the data.
Loading statistic...
Download
Source
Source
Release date
October 2022
More information
Region
Denmark, Finland, Norway, Sweden
Survey time period
October 2022
Supplementary notes
The source adds the following information: "The top list data is always based on the latest available financial statements."
The result refers to profit/loss after financial items but before extraordinary items
Subsidiaries are excluded if the parent company is on the top list with consolidated figures.
Numbers have been rounded.
Citation formats