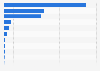
| Characteristic | N-VA | sp.a | CD&V | Vlaams Belang | Open Vld | Groen | PVDA | MR | PS | 顿茅贵滨 | Ecolo | PTB-PVDA-GO! | PTB-GO! | cdH | PP |
|---|---|---|---|---|---|---|---|---|---|---|---|---|---|---|---|
| Flemish Region | 25% | 12.1% | 17.2% | 11.3% | 12.8% | 14.1% | 4.4% | - | - | - | - | - | - | - | - |
| Brussels-Capital Region | 6.5% | 0.7% | 1.2% | 2% | 1.6% | 2.2% | - | 19.5% | 14.9% | 15.8% | 13.1% | 9% | - | 6.3% | 2% |
| Walloon Region | - | - | - | - | - | - | - | 20.6% | 23.6% | 6.9% | 10.9% | - | 13.1% | 10.1% | 6.7% |
The chart is not accessible to screen readers. Please switch to the table view to access the data.
October 2018
Belgium
September 20, 2018 to September 27, 2018
2,543 respondents
18 years and older
Online survey
The survey, conducted by Ipsos and commissioned by the Flemish commercial television VTM, RTL-TVI, the Walloon newspaper Le Soir and the Flemish newspaper HLN, is published four times per year. The survey had 2,543 respondents of which 1,000 were from Wallonia, 1,000 from Flanders and 543 from the Brussels-Capital Region. The question asked was the following: "If federal elections were held next Sunday, what party would you vote for?" ("Si de nouvelles 茅lections f茅d茅rales avaient lieu dimanche prochain, pour quel parti suivant voteriez-vous?")
The results of the voting intention surveys are separated according to region since there are no parties operating on the national level in Belgium. Dutch-speaking voters in Flanders and Brussels can vote for Dutch-speaking parties, while French-speaking voters in Wallonia and Brussels can vote for French-speaking parties.