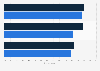
| Characteristic | Fully agree | Agree | Mostly agree | Somewhat agree | Hardly agree | Don't agree at all | No answer |
|---|---|---|---|---|---|---|---|
| - | - | - | - | - | - | - | - |
| - | - | - | - | - | - | - | - |
| - | - | - | - | - | - | - | - |
| - | - | - | - | - | - | - | - |
| - | - | - | - | - | - | - | - |
The chart is not accessible to screen readers. Please switch to the table view to access the data.
Download
Source
Source
Release date
November 2021
More information
Region
Germany
Survey time period
2017 to 2021
Age group
14 years and older
Special properties
German-speaking population
Method of interview
Computer-assisted personal interviews (CAPI)
Supplementary notes
Information on basic sample:
The survey is based on the German-speaking population aged 14 years and older.
Information on random sample:
2017: 23,106 respondents, projected base of 70.09 million people
2018: 23,086 respondents, projected base of 70.45 million people
2019: 23,120 respondents, projected base of 70.60 million people
2020: 23,138 respondents, projected base of 70.63 million people
2021: 23,299 respondents, projected base of 70.54 million people
The figures refer to the following studies:
2017: VuMA 2018; 2018: VuMA 2019; 2019: VuMA 2020; 2020: VuMA 2021; 2021: VuMA 2022.
You can find more information on the methodology of the study here.
Figures have been rounded for easier understanding.
Citation formats