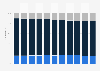
| Characteristic | 0-19 years | 20-39 years | 40-64 years | 65 years and older |
|---|---|---|---|---|
| 2024 | 1.14 | 1.41 | 1.76 | 1.33 |
| 2023 | 1.15 | 1.4 | 1.75 | 1.31 |
| 2022 | 1.15 | 1.39 | 1.74 | 1.29 |
| 2021 | 1.15 | 1.38 | 1.73 | 1.28 |
| 2020 | 1.16 | 1.38 | 1.74 | 1.26 |
| 2019 | 1.17 | 1.38 | 1.75 | 1.23 |
| 2018 | 1.18 | 1.38 | 1.75 | 1.2 |
| 2017 | 1.19 | 1.38 | 1.76 | 1.18 |
| 2016 | 1.19 | 1.39 | 1.77 | 1.15 |
| 2015 | 1.2 | 1.39 | 1.78 | 1.12 |
| 2014 | 1.2 | 1.38 | 1.8 | 1.09 |
The chart is not accessible to screen readers. Please switch to the table view to access the data.
Loading statistic...
Download
Source
Source
Release date
April 2025
More information
Region
Finland
Survey time period
2014 to 2024
Special properties
As of December 31 of the respective year
Supplementary notes
The population figures of Finland consist of permanent residents that are registered with the Finnish authorities. Non-permanent residents and those not yet registered as residents are not represented in the numbers.
For this statistic, the values have been rounded.
Citation formats