| Characteristic | More | Same | Fewer |
|---|---|---|---|
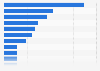
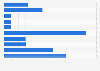
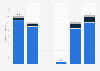
| Serviced accommodation | 41% | 41% | 18% |
| Attractions / activity operators | 38% | 39% | 23% |
| Caravan and campsites | 36% | 44% | 20% |
| Restaurants, pubs & cafes | 32% | 46% | 22% |
| Self catering | 30% | 49% | 21% |
| Hostels | 28% | 44% | 28% |
| Total | 35% | 44% | 21% |
The chart is not accessible to screen readers. Please switch to the table view to access the data.
Loading statistic...
Download
Source
Source
Release date
September 2019
More information
Region
United Kingdom (Wales)
Survey time period
Last August to early September 2019
Number of respondents
767 respondents
Special properties
Tourist businesses*
Method of interview
Telephone interviews and online survey
Supplementary notes
* Interviews were conducted with 800 business owners or managers of tourism businesses overall, including accommodation businesses (serviced, self-catering, caravan, campsites and hostels), attractions, restaurants, pubs, cafes and activity operators.
Citation formats