| Characteristic | Share of respondents |
|---|---|
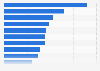
| Tape measure | 61% |
| Step ladder | 59% |
| Screwdriver (non-electric) | 57% |
| Spare light bulbs | 50% |
| Hammer | 41% |
| Stanley knife or other utility knife | 39% |
| Paint brushes | 39% |
| Set of pliers | 37% |
| Electric screwdriver | 37% |
| Drill | 36% |
| Allen key set | 28% |
| Saw | 27% |
| Electrical fuses | 25% |
| Spirit level | 24% |
| Wrench | 23% |
| Soldering iron | 11% |
The chart is not accessible to screen readers. Please switch to the table view to access the data.
Loading statistic...
Download
Source
Source
Release date
April 2015
More information
Region
United Kingdom
Survey time period
March 27 to 29, 2015
Number of respondents
2,013 respondents
Age group
18 years and older
Special properties
All who own the item
Method of interview
Online interview
Supplementary notes
The question was phrased by the source as follows: "Which of the following best describes how useful each item is to you?". Results show the share of respondents who answered 'couldn't live without' or 'It's important and gets used'.
Citation formats