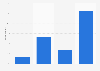
| Characteristic | Share of respondents |
|---|---|
| - | - |
| - | - |
| - | - |
| - | - |
| - | - |
| - | - |
| - | - |
| - | - |
| - | - |
| - | - |
| - | - |
The chart is not accessible to screen readers. Please switch to the table view to access the data.
Download
Source
Source
Release date
March 2026
More information
Region
United States
Survey time period
2025
Number of respondents
300+
Supplementary notes
*These include extra outlet capacity / charging stations, in-wall wireless mobile charging docks, and USB outlets.
According to the source, "the AIA Home Design Trends Survey is conducted quarterly with a panel of more than 300 architecture firms that concentrate their practice in the residential sector." Figures represent the percentage of respondents reporting popularity of product/product category 鈥渋ncreasing鈥� minus the percentage reporting 鈥渄ecreasing.鈥�
Citation formats