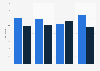
| Characteristic | Average age in years |
|---|---|
| - | - |
| - | - |
| - | - |
| - | - |
| - | - |
| - | - |
| - | - |
| - | - |
| - | - |
| - | - |
| - | - |
| - | - |
| - | - |
The chart is not accessible to screen readers. Please switch to the table view to access the data.
Download
Source
Sources
Release date
January 2019
More information
Region
United Kingdom (England)
Survey time period
April 1, 2005 to March 31, 2018
Supplementary notes
Vehicles are assigned to areas based on the main area of operation of the operator to which they belong.
This table covers all operators who run local bus services, including those who also do non-local work (e.g. private hire, school contracts). Operators who do solely non-local work are excluded.
This statistic using original data from the Government Digital Service and includes copyright material licensed under 漏 Crown, the
Citation formats