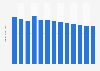
| Characteristic | Revenue in million euros |
|---|---|
| 2023 | 8,241 |
| 2022 | 8,266 |
| 2021 | 8,923 |
| 2020 | 9,328 |
| 2019 | 8,773 |
| 2018 | 9,297 |
| 2017 | 9,956 |
| 2016 | 9,201 |
| 2015 | 9,627 |
| 2014 | 10,167 |
| 2013* | 10,735 |
| 2012* | 12,607 |
| 2011 | 15,007 |
| 2010 | 14,935 |
| 2009 | 14,909 |
| 2008 | 15,243 |
| 2007 | 14,031 |
| 2006 | 13,400 |
| 2005 | 12,175 |
| 2004 | 10,975 |
The chart is not accessible to screen readers. Please switch to the table view to access the data.
Loading statistic...
Download
Source
Sources
Release date
March 2024
More information
Region
Germany
Survey time period
2004 to 2023
Special properties
private demand
Supplementary notes
* From 2013 onwards, recording media was classified as information technology instead of consumer electronics. The figure for 2012 was adjusted retroactively and is only comparable to earlier figures to a limited extent.
The consumer electronics section consists of the following segments: TV-display, video, camcorders, digital cameras, satellite/set-top boxes, home audio, portable audio, car audio/navigation, audio/video accessories and video games (up to 2011: also recording media). IT and telecommunications equipment is considered seperately.
Citation formats