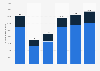
| Characteristic | Share of respondents |
|---|---|
| Getting directions/GPS Navigation | 87% |
| Taking photographs | 78% |
| Discovering local restaurants and bars | 63% |
| Finding local stores/sites to visit | 61% |
| Finding out about events going on in the city | 56% |
| Reading reviews of local establishments | 50% |
| Looking up or storing schedules for public transportation | 38% |
| Buying tickets to an event or attraction (concert, museum, etc.) | 31% |
| Making restaurant reservations | 31% |
| Translating foreign languages | 29% |
The chart is not accessible to screen readers. Please switch to the table view to access the data.
Loading statistic...
Download
Source
Source
Release date
September 2014
More information
Region
United States
Survey time period
July 21 to 30, 2014
Number of respondents
1,002 respondents
Special properties
Have traveled out of state for leisure purposes in the last year or is planning to in the next year and is the travel decision maker in his/her household
Method of interview
Online survey
Supplementary notes
Citation formats