

| Characteristic | Computer | Tablet | Smartphone |
|---|---|---|---|
| - | - | - | - |
| - | - | - | - |
| - | - | - | - |
| - | - | - | - |
| - | - | - | - |
| - | - | - | - |
| - | - | - | - |
The chart is not accessible to screen readers. Please switch to the table view to access the data.
Download
Source
Sources
Release date
August 2014
More information
Region
United States
Survey time period
May 2014
Number of respondents
500 respondents
Special properties
Consumers who used a digital coupon, offer, or online promotion code in the past three months
Supplementary notes
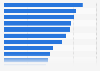
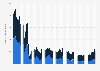
"How many of the digital coupons, offers, or online promotion codes that you found using a computer/tablet/smartphone on the past three months did you ultimately use while shopping in a store or online?"
Percentages may not add up to 100 percent due to rounding.
Citation formats