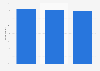
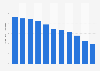
| Characteristic | Scores of 0 to 10, (10 being the best) |
|---|---|
| - | - |
| - | - |
| - | - |
| - | - |
| - | - |
| - | - |
| - | - |
| - | - |
| - | - |
| - | - |
| - | - |
The chart is not accessible to screen readers. Please switch to the table view to access the data.
October 2018
United Kingdom (Northern Ireland)
2018
Scores are measured using thefollowing criteria:
Income: Household disposable income per capita (in real USD PPP)
Jobs: Employment rate (%) Unemployment rate (%)
Housing: Number of rooms per person (ratio)
Health: Life expectancy at birth (years) Age adjusted mortality rate (per 1 000 people)
Education: Share of labour force with at least secondary education (%)
Environment: Estimated average exposure to air pollution in PM2.5 (碌g/m鲁), based on satellite imagery data
Safety: Homicide rate (per 100 000 people)
Civic engagement: voter turnout (%)
Accessibility of services: Share of households with broadband access (%)
Community: Percentage of people who have friends or relatives to rely on in case of need
Life satisfaction: Average self-evaluation of life satisfaction on a scale from 0 to 10