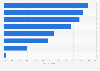
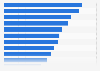
| Characteristic | Share of respondents |
|---|---|
| - | - |
| - | - |
| - | - |
| - | - |
| - | - |
| - | - |
| - | - |
| - | - |
| - | - |
| - | - |
| - | - |
| - | - |
| - | - |
| - | - |
| - | - |
| - | - |
| - | - |
| - | - |
| - | - |
| - | - |
| - | - |
| - | - |
| - | - |
The chart is not accessible to screen readers. Please switch to the table view to access the data.
Download
Source
Source
Release date
May 2014
More information
Region
United States
Survey time period
August 7 to December 20, 2013
Number of respondents
1,080 journalists
Method of interview
Online survey
Supplementary notes
The sample included 358 daily newspaper journalists, 238 from weekly newspapers, 132 from television stations and networks, 97 from radio, 92 from online news organizations, 103 from the wire services, and 60 from news magazines.
Citation formats