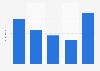
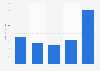

| Characteristic | Operations research analysts | Web developers | Computer systems analysts* | Database administrators | Software developers, applications and systems software) | Computer support specialists | Computer programmers | Network and computer systems administrators | Computer hardware engineers |
|---|---|---|---|---|---|---|---|---|---|
| 2021 | 51% | 38.7% | 37.5% | 35% | 19.7% | 19.5% | 19.5% | 17.2% | 13.4% |
| 2020 | 42.9% | 27.8% | 35.6% | 28.8% | 19.4% | 25.9% | 21.1% | 19.8% | 18.4% |
| 2019 | 42.7% | 41.4% | 40.1% | 30.2% | 18.7% | 26.4% | 20.3% | 26.1% | 22.8% |
| 2018 | 49.1% | 32.5% | 37.5% | 37.9% | 19.3% | 28.1% | 21.2% | 21.2% | 18.9% |
| 2017 | 51.5% | 32.3% | 38.9% | 40.6% | 18.7% | 27.1% | 21.2% | 23.5% | 17.2% |
| 2016 | 55.4% | 33.6% | 35.7% | 46.2% | 20% | 25.5% | 22.6% | 17.1% | 24.7% |
| 2015 | 50.7% | 34.3% | 34.2% | 38% | 17.9% | 26.4% | 21% | 15.9% | 12.8% |
| 2014 | 55.4% | 35.2% | 34.2% | 28% | 19.8% | 26.6% | 21.4% | 19.1% | 15.3% |
| 2013 | 52% | 39.5% | 34.9% | 37.4% | 19.7% | 29% | 23% | 17.3% | 9.2% |
| 2009 | 47% | - | 27% | 35% | 20% | 27% | 20% | 22% | 9% |
| 2005 | 50% | - | 30% | 33% | 22% | 33% | 26% | 19% | 11% |
| 2000 | 51% | - | 34% | 43% | 24% | 35% | 26% | 23% | 22% |
The chart is not accessible to screen readers. Please switch to the table view to access the data.
Loading statistic...
Download
Source
Source
Release date
January 2022
More information
Region
United States
Survey time period
2000, 2005, 2009, 2013 to 2021
Age group
16 years and older
Supplementary notes
*Until 2013, the category was titled "Computer scientists and systems analysts"
Citation formats