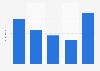

| Characteristic | White | African American/Black | Asian/Pacific Islander | Latina/Hispanic | Total Women |
|---|---|---|---|---|---|
| 2007 | 17.1% | 2.4% | 4.4% | 1.2% | 25.1% |
| 2008 | 18% | 2.6% | 3.9% | 1.3% | 24.3% |
| 2009 | 18.3% | 2.3% | 4.1% | 1.4% | 24.6% |
| 2010 | 19.8% | 2.6% | 4.2% | 1.2% | 26.5% |
| 2011 | 17.4% | 2.7% | 3.8% | 1.1% | 25.2% |
| 2012 | 17.8% | 2.7% | 3.2% | 1.4% | 26.1% |
| 2013 | 17.1% | 3% | 5.1% | 1.6% | 25.2% |
| 2014 | 17.7% | 2.9% | 4.7% | 1.4% | 25.9% |
| 2015 | 16.3% | 3% | 5% | 1.7% | 24.2% |
| 2016 | 16.9% | 2.7% | 5.5% | 1.6% | 26.5% |
| 2017 | 16.3% | 3.3% | 5.1% | 1.4% | 25.7% |
| 2018 | 15.8% | 3.2% | 6% | 2% | 25.6% |
| 2019 | 15.3% | 3.1% | 6.6% | 2.2% | 27.3% |
| 2020 | 13% | 3% | 7% | 2% | 25% |
The chart is not accessible to screen readers. Please switch to the table view to access the data.
Zoomable Statistic: Select the range in the chart you want to zoom in on.
Loading statistic...
Download
Source
Sources
Release date
May 2021
More information
Region
United States
Survey time period
2007 to 2020
Age group
16 years and older
Supplementary notes
Computer and mathematical occupations include computer and mathematical occupations, computer systems analyst, information security analysts, computer programmers, software developers for applications and systems software, web developers, computer support specialists, database administrators, network and computer systems administrators, computer network architects, actuaries, mathematicians, operations research analysts, statisticians and miscellaneous mathematical science and computer occupations.
In 2007, data is taken from Table Four. From 2008 to 2010, data is taken from Table Five. From 2011 to 2017, data is taken from Table Seven. Racial ethnic categories do not add to the total because people who identify as Hispanic/Latino can be of any race. Therefore, all individuals represented in the Hispanic/Latina category above are also counted as white, Black, or Asian/Pacific Islander.
Citation formats