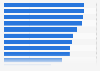
| Characteristic | Factored healthiness score* |
|---|---|
| - | - |
| - | - |
| - | - |
| - | - |
| - | - |
| - | - |
The chart is not accessible to screen readers. Please switch to the table view to access the data.
Download
Source
Sources
Release date
April 2014
More information
Region
United States
Survey time period
as of April 2014
Supplementary notes
* The factored healthiness score was caluclated by doubling the percentage of those who said a QSR was "very healthy" and adding the percentage who said it was "healthy," then subtracting the doubled percentage of those who said "very unhealthy" and the percentage of those who said "unhealthy."
The source does not specify the type or date of survey. The date of survey provided is the publication date.
Citation formats