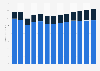
| Characteristic | 2012 | 2013 | 2014 | 2015 | 2016 | 2017 | 2018 | 2019 | 2020 | 2021 |
|---|---|---|---|---|---|---|---|---|---|---|
| Total nations and regions | 45.8% | 52.5% | 53.3% | 48.1% | 50.6% | 51.1% | 50.7% | 50.7% | 47.9% | 54% |
| London | 54.2% | 47.5% | 46.7% | 51.9% | 49.4% | 48.9% | 49.3% | 49.3% | 52.1% | 46.4% |
| Total regions excl. London | 30.1% | 32.6% | 35.2% | 31.6% | 31.4% | 32.9% | 30.9% | 30% | 31.5% | 33.9% |
| Total nations | 15.7% | 19.9% | 18.1% | 16.6% | 19.2% | 18.2% | 19.8% | 20.8% | 16.4% | 19.7% |
| North of England | 16.7% | 17.2% | 23.1% | 17.4% | 19.7% | 18.4% | 17.6% | 14% | 17.4% | 17.4% |
| South of England | 7.4% | 8.5% | 7.6% | 9.3% | 7.6% | 8.7% | 8.6% | 9.8% | 10.1% | 10.2% |
| Scotland | 7.6% | 10.9% | 9.2% | 7.7% | 10.3% | 9.1% | 10.4% | 9.1% | 6.5% | 8.6% |
| Wales | 6.8% | 6.8% | 6.5% | 7.1% | 5.8% | 6.7% | 6.3% | 8.2% | 8.2% | 7.2% |
| Multi-region** | 2.3% | 4.1% | 2.8% | 3% | 2.6% | 3.9% | 2.5% | 3.3% | 1.5% | 4.3% |
| Northern Ireland | 1.3% | 2.2% | 2.5% | 1.8% | 3.1% | 2.4% | 3.1% | 3.5% | 1.7% | 3.9% |
| Midlands | 3.7% | 2.7% | 1.7% | 1.8% | 1.5% | 1.9% | 2.2% | 2.8% | 2.5% | 2% |
The chart is not accessible to screen readers. Please switch to the table view to access the data.
Loading statistic...
Download
Source
Source
Release date
July 2022
More information
Region
United Kingdom
Survey time period
2012 to 2021*
Supplementary notes
* Network television spend based on Ofcom definitions by calendar year.
** Multi-region covers programmes made outside London but which cannot be attributed to any one region or nation.
Citation formats