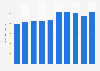
| Characteristic | Sales in terawatt-hours |
|---|---|
| 2024 | 403.4 |
| 2023 | 407 |
| 2022 | 462.9 |
| 2021 | 448.1 |
| 2020 | 385 |
| 2019 | 257.3 |
| 2018 | 135.1 |
| 2017 | 141.1 |
| 2016* | 142.8 |
| 2015 | 1,721.8 |
| 2014 | 1,171 |
| 2013 | 1,219.3 |
| 2012 | 1,162.1 |
| 2011 | 1,107.5 |
| 2010 | 1,342.4 |
| 2009 | 1,206.5 |
| 2008 | 1,208.6 |
| 2007 | 1,072.3 |
| 2006 | 949.6 |
| 2005 | 924.4 |
The chart is not accessible to screen readers. Please switch to the table view to access the data.
Loading statistic...
Download
Source
Source
Release date
February 2025
More information
Region
Worldwide
Survey time period
FY 2005 to FY 2024
Supplementary notes
This statistic was compiled using several releases of the publication.
E.ON separated its conventional power generation and energy trading operations into a new company, Uniper, as of January 1, 2016.
Citation formats